Solution - long version
Solution most often found on the internet when searching for "debugging console programs in gdb" is to redirect input and output of debugged program to a different, separate terminal. Basics of redirecting input/output are described in paragraph 4.6 of gdb manual [2].
It turns out that in some cases this is not enough, because we need to configure our debugging environment a bit further. Steps listed below present full reasoning behind short version of procedure that you've seen above. This full reasoning includes some trials and errors, and full procedure with backtracking goes like this:
- We start two terminals, let's call them gdb terminal and program terminal. We can arrange them on our screen so that we can see them both at the same time.
- In gdb terminal we run emacs, in emacs we issue command
M-x gdb
- If we run emacs in directory where debugged program is located, emacs will prompt us with something like this: "gdb --annotate=3 <name of debugged program>". Otherwise we will see only "gdb --annotate=3". In second case we can specify full path to debugged program in current emacs prompt, or we can specify it later in gdb with gdb's "file" command [1]. In either case we press Enter in emacs prompt.
- In program terminal we issue command
$ tty
Result will be something like "/dev/pts/3" or "/dev/tty2" depending on what terminal we use. Value returned by tty program is a device file describing current terminal. It will be "real" terminal, like "/dev/tty2" if we don't use X Window environment, or it will be "pseudo" terminal, like "/dev/pts/5" if we use a terminal emulator provided by desktop environment, e.g. konsole, gnome-terminal, xterm etc. - In gdb we issue command similar to this:
(gdb) tty /dev/pts/3
Instead of "/dev/pts/3" we have to use real value returned by tty command in program terminal in previous step. gdb uses inferior-tty variable to store information about debugged program's terminal (input and output device), so we can use set and show gdb commands to operate on this variable. - In program terminal we run command
$ sleep 1000000
This is to ensure that the keys that we press when using program terminal are sent to debugged program, and not to shell in program terminal [3]. The value's units are seconds, so the value must be large enough so that debugged program doesn't start behaving strangely during debugging session.
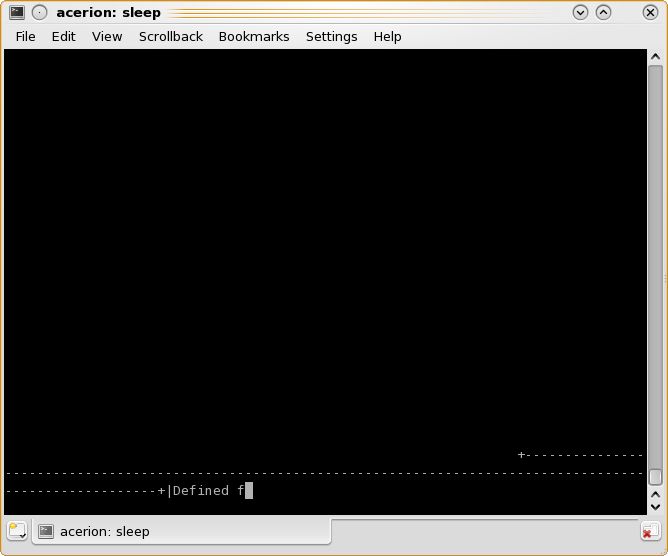
This is where most of widely available instructions end. They work pretty well for non-(n)curses program executed under gdb + emacs pair, or for ncurses program executed under gdb alone. However it is not so easy for mix of emacs+gdb+ncurses program. This is what we can see in program terminal when we follow steps listed above, running in gdb demo_forms, a sample ncurses program:

This is clearly not what we expected. Other, more advanced programs using ncurses library give a hint at a source of this problem. Midnight Commander, when invoked in gdb, prints this message before exiting: "Your terminal lacks the ability to clear the screen or position the cursor.". This means that terminal mode used by gdb may be incorrect. This leads to next steps in our procedure, where we first check what is the terminal mode of program terminal, and then we check what gdb thinks about its current terminal mode:
- In program terminal we exit demo_forms
program, press Ctrl+C to exit sleep
command and we issue command
$ echo $TERM
Result will be something like xterm, vt100, rxvt or linux. This tells us what mode of terminal is used by program terminal. The same mode must be used by gdb. We can first check what is the current mode of terminal in gdb (what gdb thinks that the current terminal mode is): - In gdb we use "show env name"
command to check value of gdb's environment variable:
[4]
(gdb) show env TERM
Result will be most probably "TERM = dumb" or maybe "TERM = emacs". There is clearly a mismatch between what gdb thinks about mode of terminal to which we want to redirect input and output of debugged program, and what the real mode of program terminal is. This probably can be fixed permanently with an entry in gdb configuration file, but immediate fix is in next step: - In gdb we issue command
(gdb) set env TERM=name
where "name" is a result of the command "echo $TERM" issued in program terminal. - In program terminal we again issue command
$ sleep 1000000
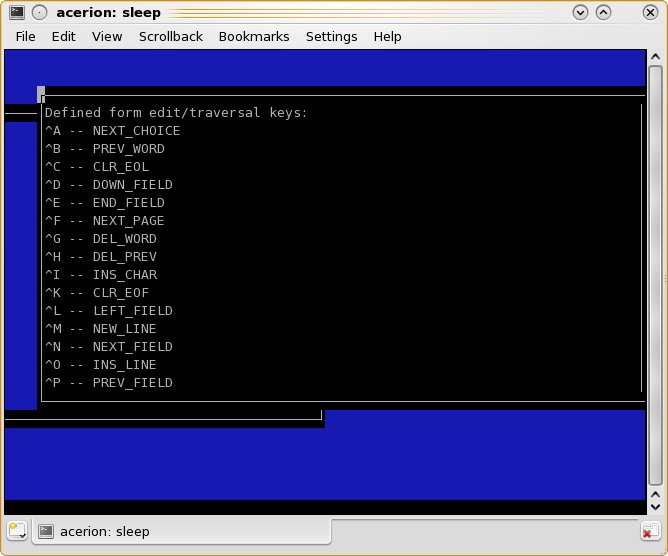
After completing these steps and running the demo_forms sample program in gdb we can see that results are a lot better, but there are some problems with frames displayed in terminal window:

Program's output looks like it doesn't quite fit into terminal, as if the debugged program thinks that terminal's size is different than it really is. Let's investigate further:
- In program terminal we exit demo_forms
program and press Ctrl+C to exit
sleep command. Then we issue command
$ stty -a
Output of stty command contains information about number of rows and columns. The information will look like this: "rows 41; columns 126;". These values are number of rows and columns that program terminal can display given its current X/Y size and size of font used by terminal. The values will be useful later. - At this point we can again use
"show env name" command in gdb to
check current settings in gdb:
(gdb) show env COLUMNS
(gdb) show env ROWS
It will probably turn out that these values are larger than rows/columns size in program terminal. It may even turn out that ROWS or COLUMNS is not defined at all. In either case we fix this as shown in next step: - In gdb we issue two commands:
(gdb) set env COLUMNS=80
(gdb) set env ROWS=25
The two numerical values used here are just examples, but they must be no larger than respective values reported by stty in program terminal. I'm not sure about this, but for some cases it may turn out that they have to be equal to values reported by stty. NOTE: if debugged program has some requirements regarding minimal number of rows and columns, we have to make sure that size of program terminal (i.e. the number of rows and columns printed by stty command) meets these requirements. Resize the program terminal if necessary. - In program terminal we issue again sleep command:
$ sleep 1000000
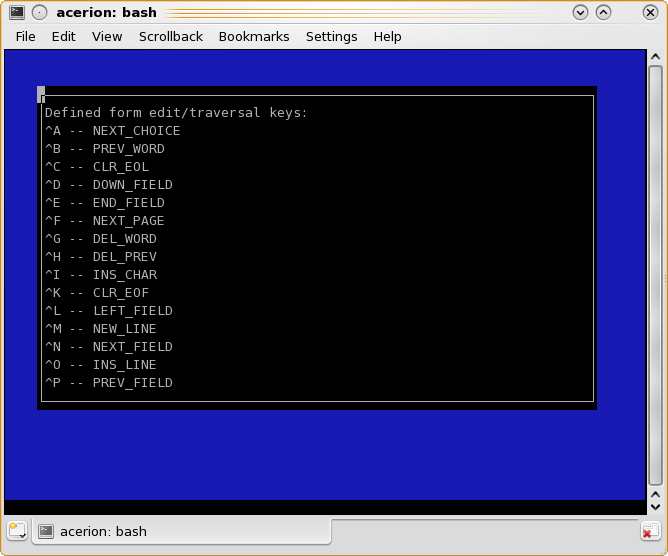
- In gdb we run demo_forms program again (the "r" command in gdb), and this time output of the program in program terminal looks correctly:

And that is all, this is how emacs, gdb and additional terminal are configured for debugging session. When you finish your debugging session you may need to clean up in your program terminal.
Top of page